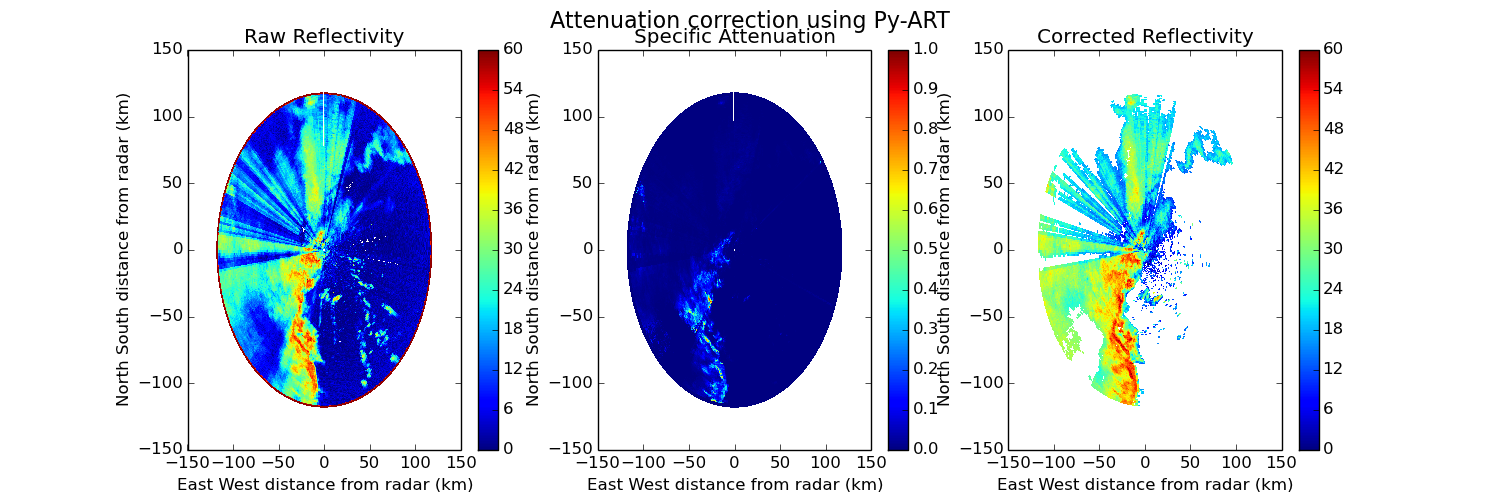
Correct reflectivity attenuation
In this example the reflectivity attenuation is calculated and then corrected for a polarimetric radar using a Z-PHI method implemented in Py-ART.
Python source code: plot_attenuation.py
print __doc__

# Author: Jonathan J. Helmus (jhelmus@anl.gov)
# License: BSD 3 clause

import matplotlib.pyplot as plt
import pyart

RADAR_NAME = 'sgpcsaprsurcmacI7.c0.20110520.095101.nc'

# read in the data
radar = pyart.io.read_cfradial(RADAR_NAME)

# remove existing corrections
radar.fields.pop('specific_attenuation')
radar.fields.pop('corrected_reflectivity_horizontal')

# perform attenuation correction
spec_at, cor_z = pyart.correct.calculate_attenuation(
    radar, 0, refl_field='reflectivity_horizontal',
    ncp_field='norm_coherent_power', rhv_field='copol_coeff',
    phidp_field='proc_dp_phase_shift')
radar.add_field('specific_attenuation', spec_at)
radar.add_field('corrected_reflectivity_horizontal', cor_z)

# create the plot
fig = plt.figure(figsize=(15, 5))
ax1 = fig.add_subplot(131)
display = pyart.graph.RadarDisplay(radar)
display.plot_ppi('reflectivity_horizontal', 0, ax=ax1, vmin=0, vmax=60.,
                 colorbar_label='',
                 title='Raw Reflectivity')

ax2 = fig.add_subplot(132)
display.plot_ppi('specific_attenuation', 0, vmin=0, vmax=1.0,
                 colorbar_label='', ax=ax2,
                 title='Specific Attenuation')

ax3 = fig.add_subplot(133)
display = pyart.graph.RadarDisplay(radar)
display.plot_ppi('corrected_reflectivity_horizontal', 0, vmin=0, vmax=60.,
                 colorbar_label='', ax=ax3,
                 title='Corrected Reflectivity')

plt.suptitle('Attenuation correction using Py-ART', fontsize=16)
plt.show()
Total running time of the example: 9.03 seconds