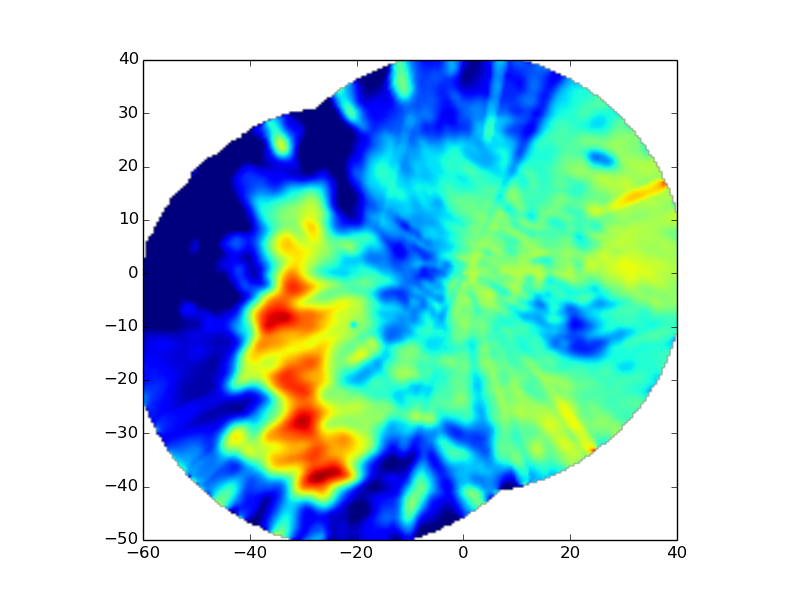
Map two radars to a Cartesian grid
Map the reflectivity field of two nearby ARM XSARP radars from antenna coordinates to a Cartesian grid.
Python source code: plot_map_two_radars_to_grid.py
print __doc__

# Author: Jonathan J. Helmus (jhelmus@anl.gov)
# License: BSD 3 clause

import matplotlib.pyplot as plt
import pyart

# read in the data from both XSAPR radars
XSAPR_SW_FILE = 'swx_20120520_0641.nc'
XSAPR_SE_FILE = 'sex_20120520_0641.nc'
radar_sw = pyart.io.read_cfradial(XSAPR_SW_FILE)
radar_se = pyart.io.read_cfradial(XSAPR_SE_FILE)

# perform Cartesian mapping, limit to the reflectivity field.
grid = pyart.map.grid_from_radars(
    (radar_se, radar_sw),
    grid_shape=(201, 201, 2),
    grid_limits=((-60000, 40000), (-50000, 40000), (0, 1000)),
    grid_origin = (36.57861, -97.363611),
    fields=['corrected_reflectivity_horizontal'],
    refl_field='corrected_reflectivity_horizontal',
    max_refl=100.)

# create the plot
fig = plt.figure()
ax = fig.add_subplot(111)
ax.imshow(grid.fields['corrected_reflectivity_horizontal']['data'][1],
          origin='lower', extent=(-60, 40, -50, 40), vmin=0, vmax=48)
plt.show()
Total running time of the example: 51.79 seconds