Create a multiple panel RHI plot from a CF/Radial file
An example which creates a multiple panel RHI plot of a CF/Radial file using both a CFRadialDisplay and a RadarDisplay object.
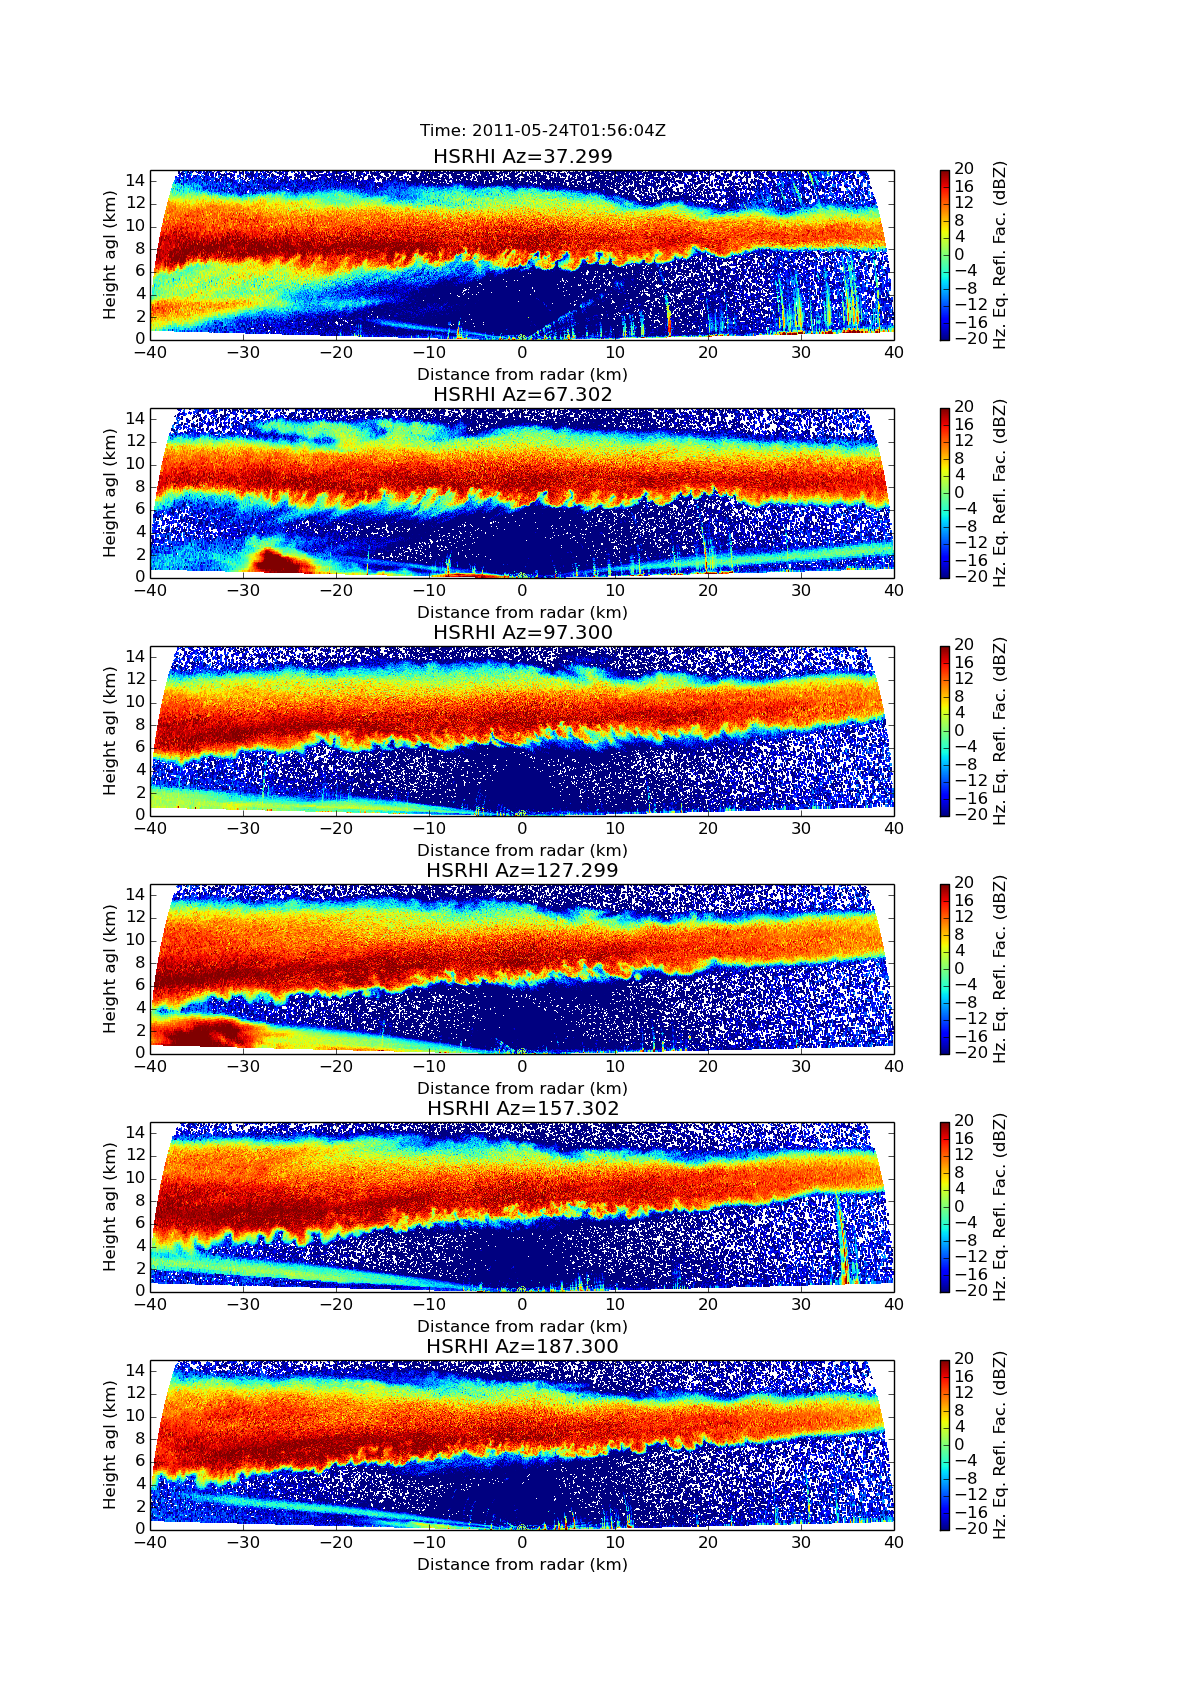

Python source code: plot_rhi_cfradial.py
print __doc__

# Author: Jonathan J. Helmus (jhelmus@anl.gov)
# License: BSD 3 clause

import netCDF4
import matplotlib.pyplot as plt
import pyart

filename = 'sgpxsaprrhicmacI5.c0.20110524.015604_NC4.nc'

# create the plot using CFRadialDisplay
dataset = netCDF4.Dataset(filename, 'r')
display = pyart.graph.CFRadialDisplay(dataset)

fig = plt.figure(figsize=[12, 17])
fig.subplots_adjust(hspace=0.4)
xlabel = 'Distance from radar (km)'
ylabel = 'Height agl (km)'
colorbar_label = 'Hz. Eq. Refl. Fac. (dBZ)'
nplots = len(dataset.variables['sweep_number'])

for snum in dataset.variables['sweep_number']:

    title = 'HSRHI Az=%.3f' % dataset.variables['fixed_angle'][snum]
    ax = fig.add_subplot(nplots, 1, snum+1)
    display.plot_rhi('reflectivity_horizontal', snum, vmin=-20, vmax=20,
                     mask_outside=False, title=title,
                     axislabels=(xlabel, ylabel),
                     colorbar_label=colorbar_label, ax=ax)
    display.set_limits(ylim=[0, 15], ax=ax)

figure_title = 'Time: ' + display.time_begin.isoformat() + 'Z'
fig.text(0.35, 0.92, figure_title)

plt.show()

# create the plot using RadarDisplay
radar = pyart.io.read_cfradial(filename)
radar.metadata['instrument_name'] = 'XSARP'
display = pyart.graph.RadarDisplay(radar)

fig = plt.figure(figsize=[12, 17])
fig.subplots_adjust(hspace=0.4)
xlabel = 'Distance from radar (km)'
ylabel = 'Height agl (km)'
colorbar_label = 'Hz. Eq. Refl. Fac. (dBZ)'
nplots = len(dataset.variables['sweep_number'])

for snum in radar.sweep_number['data']:

    fixed_angle = radar.fixed_angle['data'][snum]
    title = 'HSRHI Az=%.3f' % (fixed_angle)
    ax = fig.add_subplot(nplots, 1, snum+1)
    display.plot_rhi('reflectivity_horizontal', snum, vmin=-20, vmax=20,
                     mask_outside=False, title=title,
                     axislabels=(xlabel, ylabel),
                     colorbar_label=colorbar_label, ax=ax)
    display.set_limits(ylim=[0, 15], ax=ax)

figure_title = 'Time: ' + display.time_begin.isoformat() + 'Z'
fig.text(0.35, 0.92, figure_title)

plt.show()
Total running time of the example: 5.51 seconds