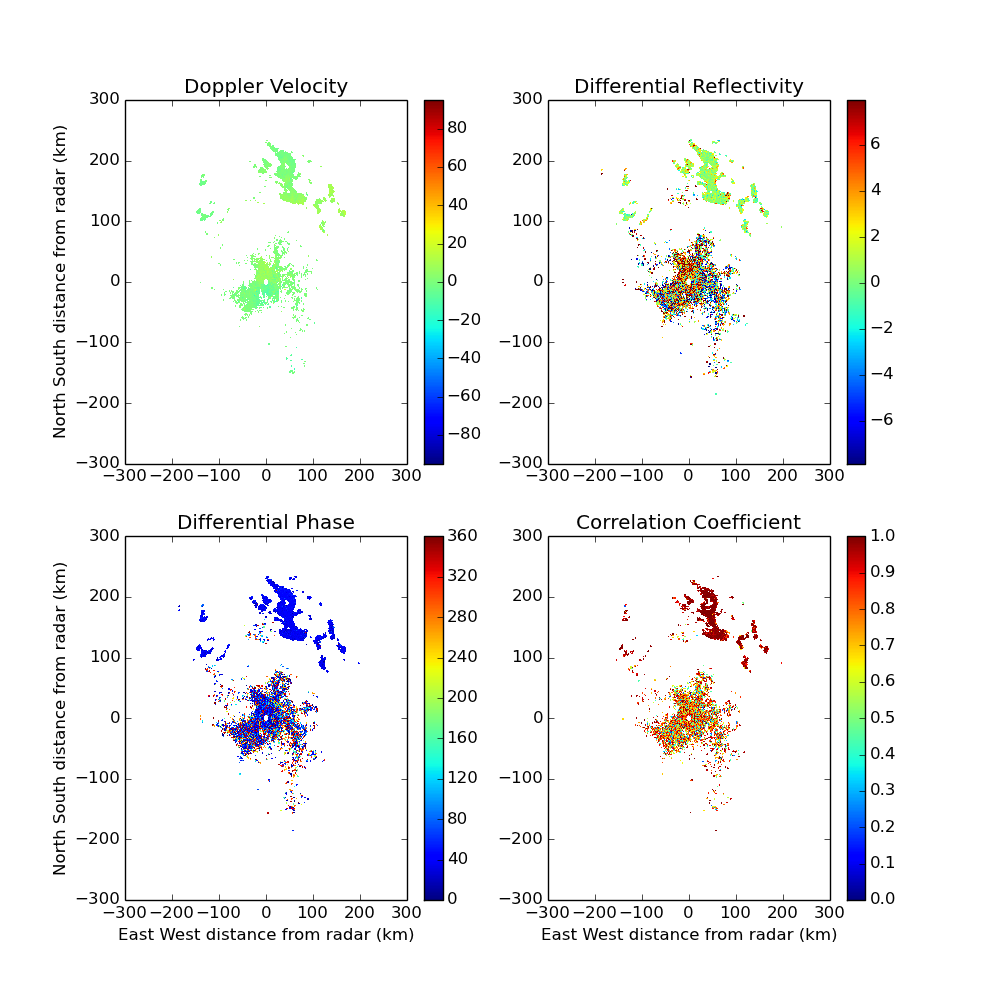
Create a plot of multiple moments from a NEXRAD file
An example which creates a plot containing multiple moments taken from a NEXRAD Archive file.
Python source code: plot_nexrad_multiple_moments.py
print(__doc__)

# Author: Jonathan J. Helmus (jhelmus@anl.gov)
# License: BSD 3 clause

import matplotlib.pyplot as plt
import pyart

filename = 'KATX20130717_195021_V06'
radar = pyart.io.read_nexrad_archive(filename)
display = pyart.graph.RadarDisplay(radar)
fig = plt.figure(figsize=(10, 10))

ax = fig.add_subplot(221)
display.plot_ppi('velocity', 1, ax=ax, title='Doppler Velocity',
                 colorbar_label='',
                 axislabels=('', 'North South distance from radar (km)'))
display.set_limits((-300, 300), (-300, 300), ax=ax)

ax = fig.add_subplot(222)
display.plot_ppi('differential_reflectivity', 0, ax=ax,
                 title='Differential Reflectivity', colorbar_label='',
                 axislabels=('', ''))
display.set_limits((-300, 300), (-300, 300), ax=ax)

ax = fig.add_subplot(223)
display.plot_ppi('differential_phase', 0, ax=ax,
                 title='Differential Phase', colorbar_label='')
display.set_limits((-300, 300), (-300, 300), ax=ax)

ax = fig.add_subplot(224)
display.plot_ppi('cross_correlation_ratio', 0, ax=ax,
                 title='Correlation Coefficient', colorbar_label='',
                 axislabels=('East West distance from radar (km)', ''))
display.set_limits((-300, 300), (-300, 300), ax=ax)

plt.show()
Total running time of the example: 5.40 seconds