Create a PPI plot from a MDV file
An example which creates a PPI plot of a MDV file using both a MdvDisplay and a RadarDisplay object.
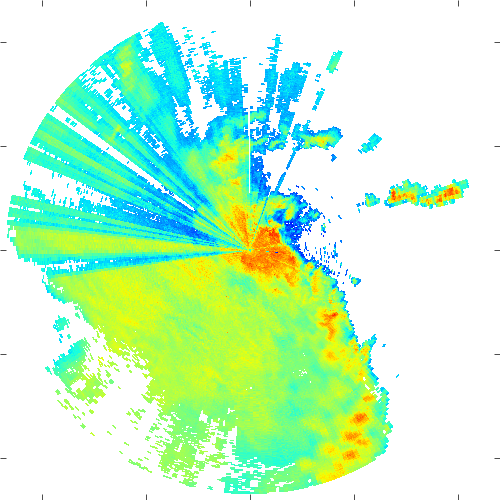

Python source code: plot_ppi_mdv.py
print(__doc__)

# Author: Jonathan J. Helmus (jhelmus@anl.gov)
# License: BSD 3 clause

import matplotlib.pyplot as plt
import pyart

filename = '110635.mdv'

# create the plot using MdvDisplay
mdvfile = pyart.io.mdv.MdvFile(filename)
display = pyart.graph.MdvDisplay(mdvfile)
fig = plt.figure(figsize=[5, 5])
ax = fig.add_subplot(111, frameon=False)
display.plot_ppi('DBZ_F', 0, mask_tuple=['NCP_F', 0.5],
                 colorbar_flag=False, title_flag=False,
                 axislabels_flag=False)
display.set_limits(ylim=[-120, 120], xlim=[-120, 120])
fig.subplots_adjust(left=0, bottom=0, right=1, top=1, wspace=0, hspace=0)
plt.show()

# create the plot using RadarDisplay
radar = pyart.io.read_mdv(filename)
display = pyart.graph.RadarDisplay(radar)
fig = plt.figure(figsize=[5, 5])
ax = fig.add_subplot(111, frameon=False)
display.plot_ppi('reflectivity', 0, vmin=-16., vmax=64,
                 mask_tuple=['normalized_coherent_power', 0.5],
                 colorbar_flag=False, title_flag=False,
                 axislabels_flag=False)
display.set_limits(ylim=[-120, 120], xlim=[-120, 120])
fig.subplots_adjust(left=0, bottom=0, right=1, top=1, wspace=0, hspace=0)
plt.show()
Total running time of the example: 4.01 seconds