Create a RHI plot from a MDV file
An example which creates a RHI plot of a MDV file using both a MdvDisplay and a RadarDisplay object.
Python source code: plot_rhi_mdv.py
print __doc__
# Author: Jonathan J. Helmus (jhelmus@anl.gov)
# License: BSD 3 clause
import matplotlib.pyplot as plt
import pyart
filename = '110041.mdv'
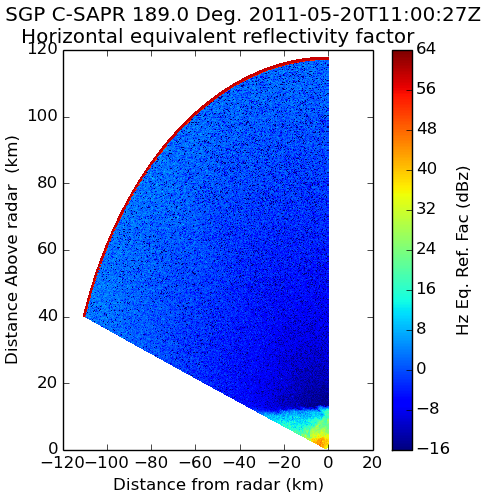
# create the plot using MdvDisplay
mdvfile = pyart.io.mdv.MdvFile(filename)
display = pyart.graph.MdvDisplay(mdvfile)
fig = plt.figure(figsize=[5, 5])
ax = fig.add_subplot(111)
display.plot_rhi('DBZ_F', 0, vmin=-16, vmax=64.0)
plt.show()
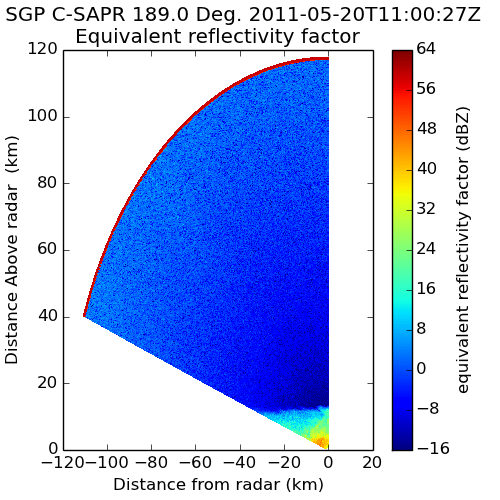
# create the plot using RadarDisplay
radar = pyart.io.read_mdv(filename)
display = pyart.graph.RadarDisplay(radar)
fig = plt.figure(figsize=[5, 5])
ax = fig.add_subplot(111)
display.plot_rhi('reflectivity', 0, vmin=-16, vmax=64.0)
plt.show()
Total running time of the example: 0.39 seconds